Remember back to last summer, when Wisconsin was blanketed in a cloud of smoke for several days and the air smelled like a campfire–with no s’mores in sight?
RELATED: ‘Unprecedented’ Wildfires Impact Wisconsin, 19+ Million Acres Burn
Poor air quality is unfortunately only expected to become a more persistent problem in the years ahead, as the country adjusts to the growing impacts of climate change. That means people with breathing problems or heart problems, older folks, and kids and teens will want to not only check the temperature before heading out the door–but the local air quality, too. And there’s an easy way to do that.
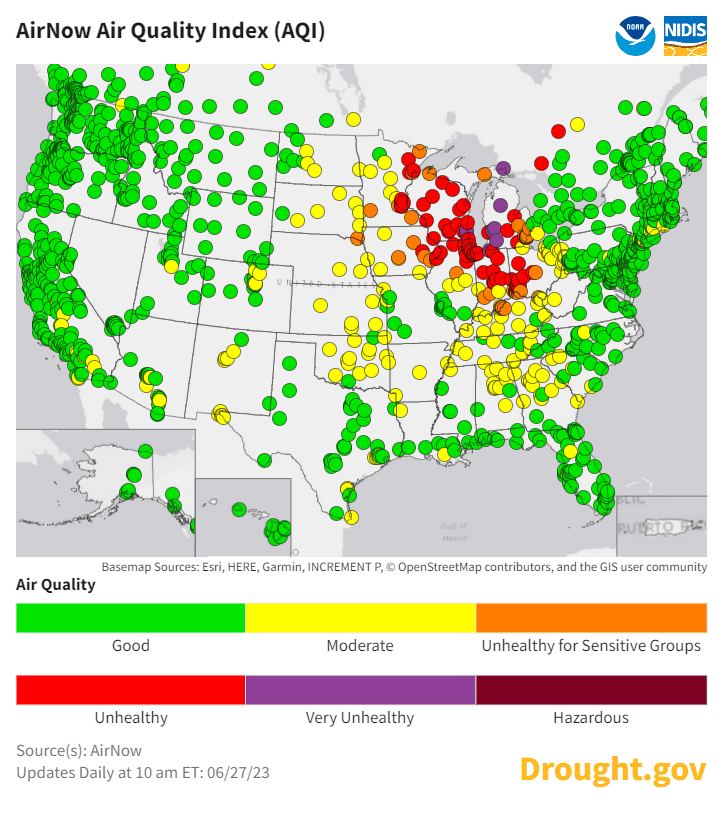
Many smartphone weather apps have already been updated to include an air quality index, which shows the local air quality on a color-coded map:
Green: Represents an air quality value of less than 50, indicating good air quality
Yellow: Value of 51-100, indicating moderate air quality, which may pose a risk to people particularly sensitive to air pollution
Orange: Value of 101-150, indicating unhealthy air quality for sensitive groups, like people with asthma or extreme allergies
Red: Value of 151-200, indicating unhealthy air quality in which people with no previous breathing problems could experience symptoms
Purple: Value of 201-300, indicating very unhealthy air quality for everyone, and a health alert is issued
Maroon: Value of 301 or higher, in which everyone is likely to be affected and is considered a health warning of emergency conditions
You can also track the air quality in your zip code by using the EPA’s AirNow website.
MORE: How Does Your Air Compare? Current World Air Quality Rankings